Protected Areas Database
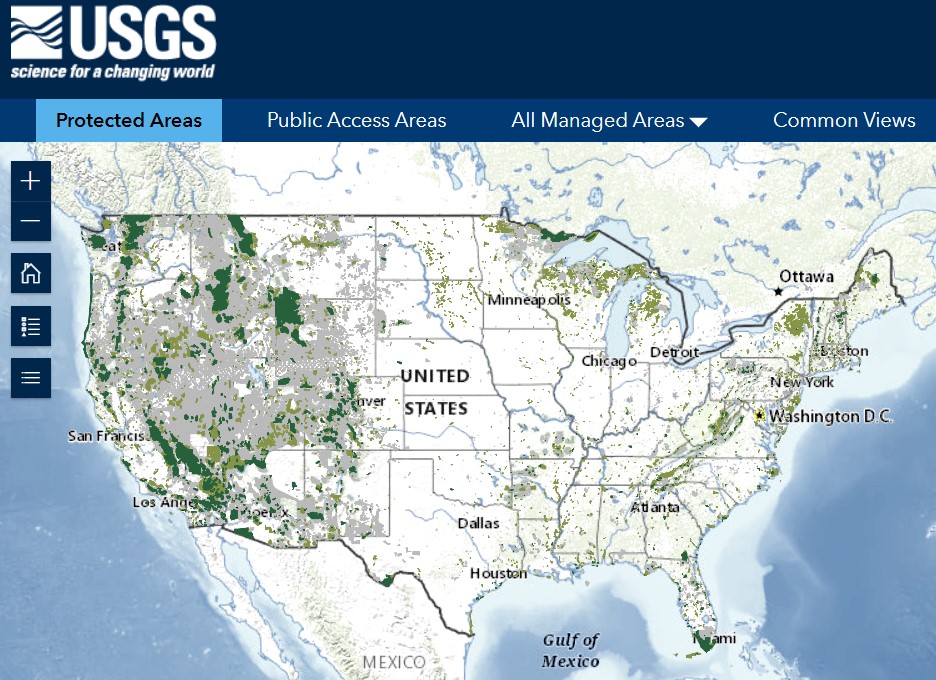
Applied Conservation assessed the inventory of Protected Areas to develop a “core portfolio” of the 2500 most important existing protected areas for conserving natural diversity.
These protected areas include national parks, national wildlife refuges, wilderness areas, nature preserves and other places designated for conservation.
Evaluation Factors
Eight factors important for capturing and conserving natural diversity were evaluated for all protected areas, using GIS datasets with coverage of the lower 48 states.

Size – The GIS-determined acreage of the protected area. Larger areas have greater species richness and better accommodate large-scale natural disturbances. Place values range from 247 to over 3 million acres. Data Source: USGS PAD-US
Landscape diversity – Land facets, involving 1000s of combinations of landforms, elevation, aspect and slope, and soil types. Also see See Nature’s Stage. Variety of facets at each area was used for Last Great Places analysis: place values range from 1 to 334. Data Source: adaptwest.databasin.org.
Ecosystem diversity – The existing vegetation type for over 700 natural upland and wetland ecological systems in the lower 48 states. Variety for each area: place values range from 1 to 115. Data Source: LANDFIRE
Imperiled species – Habitat suitability for over 2200 endangered, threatened or imperiled species. Average of maximum and mean values for each area: place values range from 0 to 27. Data Source: NatureServe
Degree of human modification (aka human footprint)– Combined degree of human settlement, agriculture, transportation, mining & energy production, and electrical infrastructure. Mean value for each area: place values range from 0 (no modification) to 1 (very high modification). Data Source: NASA
Vegetation condition – Departure of ecological systems from their natural range of variability for vegetation composition, structure and ecological processes. Mean value for each area: values range from 1 (low departure/good condition) to 100 (high departure/poor condition). Data Source: LANDFIRE
Ecological resilience – Diverse topography, bedrock, soil and micro-climates, deemed more likely to sustain native plants, animals, and natural processes into the future as climate changes. Mean value for each area: place values range from -3500 (low resilience) to +3500 (high resilience). Data Source: TNC
Conservation management status – Whether land is managed for permanent biodiversity maintenance through some legal and/or institutional mechanism. Mean value for each area based on GAP status 1 -4 (GAP 1 is managed for biodiversity; GAP 4 is no mandate for protection). Source: USGS PAD-US
Scoring
The data for all eight factors for over 50,000 protected areas over 1 square kilometer was compiled using ArcGIS Spatial Analyst and entered into a Postgres database.
Places were then ranked using a minimum/maximum scoring methodology for each of the evaluation factors (except size, which was graded on a scale using the species-area curve), with a typical scoring range of 0 to 20 for the lowest rated site to 100 for the highest rated site.
A weighted scoring system was established for purposes of analysis. For the primary Last Great Places analysis, equal weights were assigned to all eight factors, and a final score calculated for each site. Scores and Rankings were determined for places within each ecoregion (e_rank) as well as nationally.
Each site was then assigned national and ecoregional percentile rankings based on its score. The national and ecoregional ranks were equally weighted so as to include representation of sites and ecosystems across all ecoregions in the final rankings.
The 2500 top-ranked sites include areas in 68 of the 69 ecoregions in the lower 48 states and constitute the Last Great Places.
Note: Icons for evaluation factors courtesy of Flaticon
Other Datasets of Important Places
These protected areas include national parks, national wildlife refuges, wilderness areas, nature preserves and other places designated for conservation.
Two other datasets include additional places that add important contributions to biodiversity conservation.